Lesson 42 – Bounded: The language of Beta distribution

Last week, in Lesson 41, we started toying with the idea of continuous probability distributions. When a random variable X is continuous (i.e., can be any Real number), we can compute the probability of X between any two values,  P(X \in (a,b)) = P(a \le X < b) using a continuous probability distribution function  f(x) .

The continuous probability density function (pdf) is the limiting shape of the frequency plot (histogram) of the data as the number of possible observations (n) goes to infinity. While the probability that the random variable X takes any specific value x is 0, the height of the smooth curve measures how dense the probability is at that point.

In the limit, as the number of observations approaches infinity (continuous), the proportion of observations that belong to an interval (a, b) is the probability that X is in this interval;  P(X \in (a,b)) = P(a \le X < b) .

This area under the curve is computed using the integral of the function over the range a to b.

 P(a < X < b) = \int_{a}^{b} f(x) dx

I left you with a few practice questions:

If X is a random variable with a probability distribution function defined as

 f(x) = 90x^{8}(1-x) for 0 < x < 1

  1. What is the probability that X is between 0.2 and 0.3?
  2. What is the probability that X will exceed 0.9?
  3. What is the median of X?

If you have solved these questions, more power to you. If you are waiting for the stars to align, this is that auspicious moment!

Let’s solve this problem step by step to understand the nuts and bolts of continuous distributions. At the end of the problem, I will lead you to our first type of continuous probability distribution functions, the Beta distribution and its special case, the uniform distribution. You will see why I selected this problem as the primer.

Our function is  f(x) = 90x^{8}(1-x) for 0 < x < 1.

The plot of this function reveals a bell-like shape. Notice that x is between 0 and 1 and the function is continuous.

Let’s take the first question: What is the probability that X is between 0.2 and 0.3?

 P(0.2 < X < 0.3) = \int_{0.2}^{0.3} f(x) dx

 = \int_{0.2}^{0.3} 90x^{8}(1-x) dx

 = \int_{0.2}^{0.3}90x^8 dx - \int_{0.2}^{0.3}90x^{9}dx

 = \frac{90}{9} x^{9}\Big|_{0.2}^{0.3} - \frac{90}{10} x^{10}\Big|_{0.2}^{0.3}

 = \frac{90}{9}(0.3^{9}-0.2^{9}) - \frac{90}{10}(0.3^{10}-0.2^{10})

 = 0.00014

Using the same procedure, we can solve for the probability that X will exceed 0.9?

 P(X > 0.9) = \int_{0.9}^{1} f(x) dx

 = \frac{90}{9} x^{9}\Big|_{0.9}^{1} - \frac{90}{10} x^{10}\Big|_{0.9}^{1}

 = \frac{90}{9}(1^{9}-0.9^{9}) - \frac{90}{10} (1^{10}-0.9^{10})

 = 0.264

We could have integrated the function from 0 to 0.9 and then subtracted this number from 1 because  P(X > x) = 1 - P(X \le x) and  P(X \le x) = \int_{0}^{x}f(x)dx in this case.

Also, remember that  P(X \le x) = F(x), the cumulative distribution function. We will be using the cumulative distribution function very often from now on.

Now, let us look at the third question: what is the median of X?

We know from order statistics that median is the 50th percentile, i.e., the value for which 50% of the values of X are below this number.

 P(X \le x_{median}) = F(x_{median}) = 0.5

\int_{0}^{x_{median}}f(x)dx = 0.5

 \int_{0}^{x_{median}}90x^{8}(1-x)dx = 0.5

This reduces to  10x_{median}^{9} - 9x_{median}^{10} = 0.5

We can use the Newton Raphson iterative method to find that the root of this equation is 0.84 when 0 < x < 1.

Hence,  x_{median} = 0.84

Beta Distribution

Now, look at the function I gave you carefully.
 f(x) = 90x^{8}(1-x) for 0 < x < 1

It is bounded between 0 and 1.

It has some exponents for x and (1-x); 8 and 1 in this case.

It has a constant, 90, acting as a multiplier.

The function we solved is a Beta distribution. The standard form, i.e., the probability density function of a Beta distribution is

 f(x) = cx^{a-1}(1-x)^{b-1} for 0 < x < 1.

As you can see, it is defined only in the 0 to 1 range. The beta distribution is a bounded distribution. The function is 0 everywhere else.

a and b are the parameters that control the shape of the distribution. They can take any positive real numbers; a > 0 and b > 0. In our example, a = 9 and b = 2. The distorted bell shape we have for the function is because of these two values.

c is called the normalizing constant. It ensures that the pdf integrates to 1. Take, for example, our function  f(x) = 90x^{8}(1-x) .

If we integrate the function  x^{8}(1-x) between 0 to 1 (over the range of x), we will get

 \int_{0}^{1} x^{8}(1-x)= \frac{1}{90}

For the pdf f(x) to integrate to unity, we need to multiply it with a constant 90. Hence, we had 90 as the multiplier for our function.

This normalizing constant c is called the beta function and is defined as the area under the graph of  x^{a-1}(1-x)^{b-1} between 0 and 1.

 c = \frac{1}{\int_{0}^{1} x^{a-1}(1-x)^{b-1} dx}

For integer values of a and b, this constant c is defined using the generalized factorial function.

 c = \frac{(a + b - 1)!}{(a-1)!(b-1)!}

In our example, a = 9 and b =2. Applying these numbers will give

 c = \frac{(9+2-1)!}{(9-1)!(2-1)!} = \frac{10!}{8!1!} = 90.

Did you observe that we just need the values of a and b to get the Beta distribution?

We call it the beta family as the curve will have different shapes depending on the values of a and b.

Substitute a = 1 and b = 1 in the standard function and see what you get.

 c = \frac{(1 + 1 - 1)!}{(1-1)!(1-1)!} = 1

 f(x) = 1x^{1-1}(1-x)^{1-1} = 1

A constant value 1 for all x. This flat function is called the uniform distribution. It is a special case of the beta distribution when a and b are 1. It looks like a rectangle or a flat line.

Now substitute a = 2 and b = 2 and see.

a = 0.5 and b = 0.5 will be a u-shape with asymptotic ends.

I want you to experiment with different values of a and b and visualize how the shape changes, like in the opening animation. Try it this week. Don’t wait till the R lesson. You have come this far, and you are already a good coder in R.

As you see here, the beta distribution is flexible to take on different shapes.

The uniform distribution is used for simulating data from different probability distributions. Again, meditate on this idea before we see it in an R lesson.

The beta distribution is also used as a probability distribution for the probability p of an outcome. The probability of the probability 😉
In other words, if we want to estimate the probability p of an outcome, we assume prior to having any data, that p follows a beta distribution (0 < p < 1). Once we have the data, we can update this knowledge using the Bayes rule.

The beta distribution is also typically used in project management when we want to estimate the probability of completing the project ahead of schedule. The duration of each job is a random variable that can be approximated using a beta distribution as it is bounded between the worst completion time (pessimistic) and best completion time (optimistic).

Knowing this about project management, I set out to complete several pending tasks during this Thanksgiving break. My initial estimated probability of completion was 0.91. After a somewhat lazy turkey day, I now realize that my lower bound (best completion time) should have been my upper bound (worst completion time). The fix is in. The probability of completing the pending tasks’ project in the Christmas break is 0.91.

If you find this useful, please like, share and subscribe.
You can also follow me on Twitter @realDevineni for updates on new lessons.

Lesson 41 – Struck by a smooth function

Review lesson 32.

If you assume X is a random variable that represents the number of successes in a Bernoulli sequence of n trials, then this X follows a binomial distribution. The probability that this random variable X takes any value k, i.e., the probability of exactly k successes in n trials is:

Review lesson 33.

If we consider independent Bernoulli trials of 0s and 1s with some probability of occurrence p and assume X to be a random variable that measures the number of trials it takes to see the first success, then, X is said to be Geometrically distributed. The probability of first success in the kth trial is:

Review lesson 36.

The number of times an event occurs (counts) in an interval follows a Poisson distribution. The probability that X can take any particular value P(X = k) is:

The characteristic feature in all these distributions is that the random variable X is discrete. The possible outcomes are distinct numbers, which is why we called them discrete probability distributions.

Have you asked yourself, “what if the random variable X is continuous?” What is the probability that X can take any particular value x on the real number line which has infinite possibilities?

Let’s start with the most cliched thought experiment.

Yes, your guess is correct.

I am going to ask you to draw a ball at random from a box of ten balls. I am also going to ask you “what is the probability of selecting any particular ball?

Your answer will include, “not again,” and “since the balls are all identical, and there are ten in the box, the probability of selecting any particular ball is one-tenth (1/10); P(X = any ball out of ten balls) = 1/10.”

As I am about to ask my next question, you will interrupt me and give me the answer. “And if there are 20 balls, the probability will be 1/20.” You might also say, “spare your next question, because the answer is 1/100, and the visual for increasing number of balls looks like this.”

I am sure you have recognized the pattern here. As the sample size (n) becomes large, the probability of any one value approaches zero. For a continuous random variable, the number of possible outcomes is infinite, hence,

P(X = x) = 0.

For continuous random variables, the probability is defined in an interval between two values. It is computed using continuous probability distribution functions.

If you go back to lesson 15, you will recall how we made frequency plots. We partitioned the real number space into intervals or groups, recorded the number of observations (values) that fall into each group and used this grouping to build stacks.

Based on the number of observations in each interval, we can compute the probability that the random variable will occur in that intervals. For example, if there are ten observations out of 100 observations in a group, we estimate the probability that the variable occurs in this group as 10/100.

For continuous random variables, the proportion of observations in the group approaches the probability of being in the group, and the size of the group (interval range) approaches zero. For a large n, we can imagine a large number of very small intervals.

Is it too abstract?

If so, let’s take some data and observe this behavior.

We will use the same data that we used last week — daily temperature data for New York City. We have this data from 1869 to 2017, a large sample of 54227 values. We can assume that temperature data is a continuous random variable that has infinite possible values on the real number line.

I will take 500 data points at a time and place them on the number line. If there are two or more observations with the same temperature value, I will stack them. Recall that this is how we create histograms, the only difference is that I am not grouping. Each value is independent.

Observe this animation.

As the number of data points (sample size) increases, the stacks get denser and denser with overlaps. The final compact histogram can be approximated using a smooth function – a continuous probability distribution function.

Since for continuous random variables, the proportion of observations in the group approaches the probability of being in the group, the area of the interval block or the area under the curve of the smooth function is the probability that X is in that interval.

Finally, from calculus, you can see that the probability of a continuous variable in an interval a and b is:

An example area computation between -1 and 2 is shown.

The continuous probability distribution functions should obey the property of unit probability.

The limits of the integral are negative to positive infinity.

Now, we can integrate this function, f(x) up to any value x to get the cumulative distribution function (F(x)).

Since cumulative distribution function is the area under the curve up to a value of x, we are essentially computing .

Having this cumulative function is handy for computing the percentiles of the random variable.

Do you remember the concept of percentiles?

We learned in lesson 14 that percentiles are order statistics that can be used to summarize the data. A 75th percentile is that value of x which has 75% of the data less than this number. In other words, F(x) = 0.75.

Can you see how the cumulative distribution function, F(x) =  can be used to compute the percentiles?

Over the next few weeks, we will learn some special types of continuous distribution functions. Since you’ve been struck by smooth functions today, I will invite you to solve this.

If X is a random variable with a probability distribution function defined as

  • What is the median of X?
  • What is the probability that X is between 0.2 and 0.3?
  • What is the probability that X will exceed 0.9?

Post your answers in the comments section. The first correct answer will be highlighted next week.

No medal for solving it, but you don’t have to feel bad if you cannot. Many “modern engineering Ph.D. students” cannot solve this. Basic mathematics is no more a requirement in the new world with diverse backgrounds.

If you find this useful, please like, share and subscribe.
You can also follow me on Twitter @realDevineni for updates on new lessons.

Lesson 40 – Discrete distributions in R: Part II

The scarfs and gloves come out of the closet.

The neighborhood Starbucks coffee cups change red.

It’s a reminder that autumn is ending.

It’s a reminder that 4 pm is 8 pm.

It’s a reminder that winter is coming.

Today’s temperature in New York is below 30F – a cold November day.

  1. Do you want to know what the probability of a cold November day is?
  2. Do you want to know what the return period of such an event is?
  3. Do you want to know how many such events happened in the last five years?

Get yourself some warm tea. Let the room heater crackle. We’ll dive into rest of the discrete distributions in R.

Get the Data

The National Center for Environmental Information (NCEI) archives weather day for most of the United States. I requested temperature data for Central Park, NYC. Anyone can go online and submit requests for data. They will deliver it to your email in your preferred file format. I filtered the data for our lesson. You can get it from here.

Preliminary Analysis

You can use the following line to read the data file into R workspace.

# Read the temperature data file #
temperature_data = read.table("temperature_data_CentralPark.txt",header=T)

The data has six columns. The first three columns indicate the year, month and day of the record. The fourth, fifth and sixth columns provide the data for average daily temperature, maximum daily temperature, and minimum daily temperature. We will work with the average daily temperature data.

Next, I want to choose the coldest day in November for all the years in the record. For this, I will look through each year’s November data, identify the day with lowest average daily temperature and store it in a matrix. You can use the following lines to get this subset data.

# Years #
years = unique(temperature_data$Year) # Identifying unique years in the data
nyrs = length(years) # number of years of data

# November Coldest Day #
november_coldtemp = matrix(NA,nrow=nyrs,ncol=1)

for (i in 1:nyrs)
{
 days = which((temperature_data$Year==years[i]) & (temperature_data$Month==11)) # index to find november days in each year
 november_coldtemp[i,1] = min(temperature_data$TAVG[days]) # computing the minimum of these days
}

Notice how I am using the which command to find values.

When I plot the data, I notice that there is a long-term trend in the temperature data. In later lessons, we will learn about identifying trends and their causes. For now, let’s take recent data from 1982 – 2016 to avoid the issues that come with the trend.

# Plot the time series #
plot(years, november_coldtemp,type="o")
# There is trend in the data #

# Take a subset of data from recent years to avoid issues with trend (for now)-- # 
# 1982 - 2016
november_recent_coldtemp = november_coldtemp[114:148]
plot(1982:2016,november_recent_coldtemp,type="o")
Geometric Distribution

In lesson 33, we learned that the number of trials to the first success is Geometric distribution.

If we consider independent Bernoulli trials of 0s and 1s with some probability of occurrence p and assume X to be a random variable that measures the number of trials it takes to see the first success, then, X is said to be Geometrically distributed.

In our example, the independent Bernoulli trials are years. Each year can have a cold November day (if the lowest November temperature in that year is less than 30F) or not.

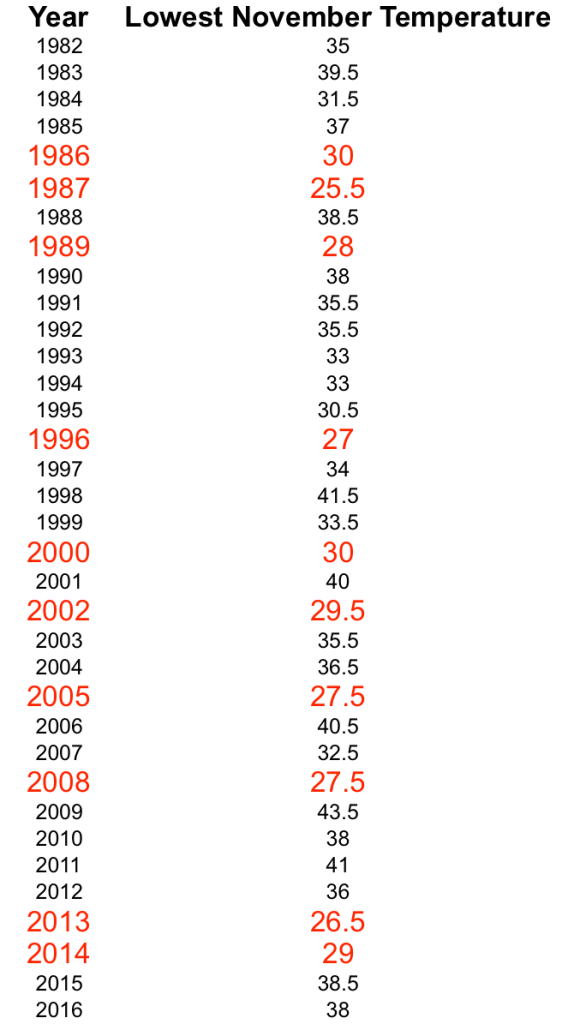
The probability of occurrence is the probability of experiencing a cold November day. A simple estimate of this probability can be obtained by counting the number of years that had a temperature < 30F and dividing this number by the total sample size. In our restricted example, we chose 35 years of data (1982 – 2016) in which we see ten years with lowest November temperature less than 30F. You can see them in the following table.

Success (Cold November) can happen in the first year, in which case X will be 1. We can see the success in the second year, in which case the sequence will be 01, and X will be 2 and so on.

In R, we can compute the probability P(X=1), P(X=2), etc., using the command dgeom. The Inputs are X and p. Try the following lines to create a visual of the distribution.

######################### GEOMETRIC DISTRIBUTION #########################

# The real data case # 
n = length(november_recent_coldtemp)

cold_years = which(november_recent_coldtemp <= 30)

ncold = length(cold_years)

p = ncold/n

x = 0:n
px = dgeom(x,p)
plot((x+1),px,type="h",xlab="Random Variable X (Cold on kth year)",ylab="Probability P(X=k)",font=2,font.lab=2)
abline(v = (1/p),col="red",lwd=2)
txt1 = paste("probability of cold year (p) = ",round(p,2),sep="")
txt2 = paste("Return period of cold years = E[X] = 1/p ~ 3.5 years",sep="")
text(20,0.2,txt1,col="red",cex=1)
text(20,0.1,txt2,col="red",cex=1)

Notice the geometric decay in the distribution. It can take X years to see the first success (or the next success from the current success). You must have seen that I have a thick red line at 3.5 years. This is the expected value of the geometric distribution. In lesson 34, we learned that the expected value of the geometric distribution is the return period of the event. On average, how many years does it take before we see the cold year again?

Did we answer the first two questions?

  1. Do you want to know what the probability of a cold November day is?
  2. Do you want to know what the return period of such an event is?

Suppose we want to compute the probability that the first success will occur within the next five years, we can use the command pgeom for this purpose.

pgeom computes P(X < 5) as P(X = 1) + P(X = 2) + P(X=3) + P(X = 4). Try it for yourself and verify that they both match.

Suppose the probability is higher or lower, how do you think the distribution will change?

For this, I created an animation of the geometric distribution with changing values of p. See how the distribution is wider for smaller values of p and steeper for larger values of p. A high value of p (probability of the cold November year) indicates that the event will occur more often; hence the trials to success are less in number. On the other hand, a smaller value for p suggests that the event will occur less frequently. The number of trials it takes to see the first/next success is more; creating a wider distribution.

Here is the code for creating the animation. We used similar code last week for animating the binomial distribution.

######## Animation (varying p) #########
# Create png files for Geometric distribution #

png(file="geometric%02d.png", width=600, height=300)

n = 35 # to mimic the sample size for november cold 
x = 0:n

p = 0.1
for (i in 1:5)
{
 px = dgeom(x,p)
 
 plot(x,px,type="h",xlab="Random Variable X (First Success on kth trial)",ylab="Probability P(X=k)",font=2,font.lab=2)
 txt = paste("p=",p,sep="")
 text(20,0.04,txt,col="red",cex=2)
 p = p+0.2
}
dev.off()

# Combine the png files saved in the folder into a GIF #

library(magick)

geometric_png1 <- image_read("geometric01.png","x150")
geometric_png2 <- image_read("geometric02.png","x150")
geometric_png3 <- image_read("geometric03.png","x150")
geometric_png4 <- image_read("geometric04.png","x150")
geometric_png5 <- image_read("geometric05.png","x150")

frames <- image_morph(c(geometric_png1, geometric_png2, geometric_png3, geometric_png4, geometric_png5), frames = 15)
animation <- image_animate(frames)

image_write(animation, "geometric.gif")

Negative Binomial Distribution

In lesson 35, we learned that the number of trials it takes to see the second success is Negative Binomial distribution. The number of trials it takes to see the third success is Negative Binomial distribution. More generally, the number of trials it takes to see the ‘r’th success is Negative Binomial distribution.

We can think of a similar situation where we ask the question, how many years does it take to see the third cold year from the current cold year. It can happen in year3, year 4, year 5, and so on, following a probability distribution.

You can set this up in R using the following lines of code.

################ Negative Binomial DISTRIBUTION #########################
require(combinat)

comb = function(n, x) {
 return(factorial(n) / (factorial(x) * factorial(n-x)))
}

# The real data case # 
n = length(november_recent_coldtemp)

cold_years = which(november_recent_coldtemp <= 30)

ncold = length(cold_years)

p = ncold/n

r = 3 # third cold year

x = r:n

px = NA

for (i in r:n)
{
 dum = comb((i-1),(r-1))*p^r*(1-p)^(i-r)
 px = c(px,dum)
}

px = px[2:length(px)]

plot(x,px,type="h",xlab="Random Variable X (Third Cold year on kth trial)",ylab="Probability P(X=k)",font=2,font.lab=2)

There is an inbuilt command in R for Negative Binomial distribution (dnbinom). I chose to write the function myself using the logic of the negative binomial distribution for a change.

The distribution has a mean of 10.5 years. The third cold year can occur approximately on the 10th year on average.

If you are comfortable so far, think about the following questions:

What happens to the distribution if you change r.

What is the probability that the third cold year will occur within seven years?

Poisson Distribution

Now let’s address the question: how many such events happened in the last five years?”

In lesson 36, Able and Mumble taught us about the Poisson distribution. We now know that counts, i.e., the number of times an event occurs in an interval follows a Poisson distribution. In our example, we are counting events that occur in time, and the interval is five years. Observe the data table and start counting how many events (red color rows) are there in each five-year span starting from 1982.

From 1982 – 1986, there is one event; 1987 – 1991, there are two events; 1992 – 1996, there is one event; 1997 – 2001, there is one event; 2002 – 2006, there are two events; 2007 – 2011, there is one event; 2012 – 2016, there are two events.

These counts (1, 2, 1, 1, 2, 1, 2) follow a Poisson distribution with an average rate of occurrence of 1.43 per five-years.

The probability that X can take any particular value P(X = k) can be computed using the dpois command in R.

Before we create the probability distribution, here are a few tricks to prepare the data.

Data Rearrangement

We have the data in a single vector. If we want to rearrange the data into a matrix form with seven columns of five years each, we can use the array command.

# rearrange the data into columns of 5 years #
data_rearrange = array(november_recent_coldtemp,c(5,7))

This rearrangement will help in computing the number of events for each column.

Counting the number of events

We can write a for loop to count the number of years with a temperature less than 30F for each column. But, R has a convenient function called apply that will perform this same analysis faster.

The apply command can be used to perform any function on the data row-wise, column-wise or both. The user can define the function.

For example, we can count the number of years with November temperature less than 30F for each column using the following one line code.

# count the number of years in each column with temp < 30
counts = apply(data_rearrange,2,function(x) length(which(x <= 30)))

The first argument is the data matrix; the second argument “2” indicates that the function has to be applied for the columns (1 for rows); the third argument is the definition of the function. In this case, we are counting the number of values with a temperature less than 30F. This one line code will count the number of events.

The rate of occurrence is the average of these numbers = 1.43 per five-year period.

We are now ready to plot the distribution for counts assuming they follow a Poisson distribution. Use the following line:

plot(0:5,dpois(0:5,mean(counts)),type="h",xlab="Random Variable X (Cold events in 5 years)",ylab="Probability P(X=k)",font=2,font.lab=2)

You can now tune the knobs and see what happens to the distribution. Remember that the tuning parameter for Poisson distribution is

I will leave you this week with these thoughts.

If we know the function f(x), we can find out the probability of any possible event from it. If the outcomes are discrete (as we see so far), the function is also discrete for every outcome.

What if the outcomes are continuous?

How does the probability distribution function look if the random variable is continuous where the possibilities are infinite?

Like the various types of discrete distributions, are there different types of continuous distributions?

I reminded you at the beginning that the autumn is ending. I am reminding you now that continuous distributions are coming.

If you find this useful, please like, share and subscribe.
You can also follow me on Twitter @realDevineni for updates on new lessons.

Lesson 39 – Discrete distributions in R: Part I

It happened again. I got a ticket for parking close to the fire hydrant. Since my first hydrant violation ticket, I have been carrying a measuring tape. I may have miscalculated the curb length this time, or the enforcer’s tape is different than mine. Either way, today’s entry for the Department of Finance’s account is +$115, and my account is -$115.

We can’t win this game. Most hydrants in New York City don’t have painted curbs. It is up to the parking enforcer’s expert judgment — also called our fate. We park and hope that our number does not get picked in the lucky draw.

I want to research the fire hydrant violation tickets in my locality. Since we are learning discrete probability distributions, the violation tickets data can serve as a neat example. New York City Open Data has this information. I will use a subset of this data: parking violations on Broadway in precinct 24 in 2017.

I am also only analyzing those unfortunate souls whose vehicles are not registered in New York and who are parked at least seven feet from the hydrant. No excuse for those who park on the hydrant. Here is a look at the 27 instances under the given criteria.

Today’s lesson includes a journey through Bernoulli trials and Binomial distribution in R and how this example fits the description. Let’s start.

First Steps

Step 1: Get the data
You can download the filtered data file here.

Step 2: Create a new folder on your computer
Let us call this folder “lesson39”. Save the data file in this folder.

Step 3: Create a new code in R
Create a new code for this lesson. “File >> New >> R script”. Save the code in the same folder “lesson39” using the “save” button or by using “Ctrl+S”. Use .R as the extension — “lesson39_code.R”. Now your R code and the data file are in the same folder.

Step 4: Choose your working directory
“lesson39” is the folder where we stored the data file. Use “setwd(“path”)” to set the path to this folder. Execute the line by clicking the “Run” button on the top right.

setwd("path to your folder")

Step 5: Read the data into R workspace
I have the filtered data in the file named “parking_data.txt“. It only contains the date when the ticket is issued. Type the following line in your code and execute it. Use header=TRUE in the command.

# Read the data to the workspace #
parking_violations = read.table("parking_data.txt",header=T)
Bernoulli Trials

There are two possibilities each day, a ticket (event occurred – success) or no ticket (event did not occur – failure). A yes or a no. These events can be represented as a sequence of 0’s and 1’s (0001100101001000) called Bernoulli trials with a probability of occurrence of p. This probability is constant over all the trials, and the trials are assumed to be independent, i.e., the occurrence of one event does not influence the occurrence of the subsequent event.

In R, we can use the command “rbinom” to create as many outcomes as we require, assuming each trial is independent.

The input arguments are the number of observations we want, the trial (1 in the case of Bernoulli) and the probability p of observing 1s.

#### Bernoulli Trials ####

# The generalized Case #
p = 0.5 # probability of success -- user defined (using 0.5 here)
rbinom(1,1,p) # create 1 random Bernoulli trial
rbinom(10,1,p) # create 10 random Bernoulli trials
rbinom(100,1,p) # create 100 random Bernoulli trials

For this example, based on our data, there are 27 parking violation tickets issues in 181 days from January 1, 2017, to June 30, 2017.

Let us first create a binary coding 0 and 1 from the data. Use the following lines to convert the day into a 1 or a 0.

# Create a Date Series #
days = seq(from=as.Date('2017/1/1'), to=as.Date('2017/6/30'), by="day")

y = as.numeric(format(days,"%y"))
m = as.numeric(format(days,"%m"))
d = as.numeric(format(days,"%d"))

binary_code = matrix(0,nrow=length(m),ncol=1)

for (i in 1:nrow(parking_violations))
{
 dummy = which(m == parking_violations[i,1] & d == parking_violations[i,2])
 
 binary_code[dummy,1] = 1
}

plot(days,binary_code,type="h",font=2,font.lab=2,xlab="Days",ylab="(0,1)")

Assuming each day is a trial where the outcome can be getting a ticket or not getting a ticket, we can estimate the probability of getting a ticket on any day as 27/181 = 0.15.

So, with p = 0.15, we can simulate 181 outcomes (0 if the ticket is not issued or 1 if the ticket is issued) using the rbinom command. An example sequence:

# For the example case #
n = 1 # it is the number of trials 
p = 0.15 # probability of the event 
nobs = 181

rbinom(nobs,n,p)

0 0 0 0 0 0 0 0 0 1 1 0 0 0 0 0 0 0 0 0 0 0 0 0 0 0 0 0 0 0 0 0 0 0 0
0 0 0 0 0 1 0 1 1 0 0 0 0 0 0 0 0 0 0 0 0 0 0 0 0 0 1 0 0 0 0 1 1 0 0
0 0 0 0 1 0 0 0 0 0 1 0 0 0 0 0 0 0 1 0 0 0 0 1 0 0 0 0 0 0 0 0 1 0 0
1 0 0 0 0 0 0 1 0 0 0 0 0 0 0 0 0 0 0 0 0 1 1 0 0 0 0 1 0 0 0 0 0 0 
0 0 0 1 0 1 0 1 0 0 0 0 0 0 0 1 0 0 0 1 0 0 0 0 0 0 0 0 1 0 0 1 0 0 
0 0 0 0 0 0

plot(rbinom(nobs,n,p),type="h",font=2,font.lab=2,xlab="Days",ylab="(0,1)")

If you simulate such sequences multiple times, on the average, you will see 27 ones.

Run this command multiple times and see how the plot changes. Each run is a new simulation of possible tickets during the 181 days. It occurs randomly, with a probability of 0.15.

Slightly advanced plotting using animation and GIF (for those more familiar with R)

In R, you can create animation and GIF based on these simulations. For example, I want to run the “rbinom” command five times and visualize the changing plots as an animation.

We first save the plots as “.png” files and then combine them into a GIF. You will need to install the “animation” and “magick” packages for this. Try the following lines to create a GIF for the changing Bernoulli plot.

######## Animation #########
# Create png files for Bernoulli sequence #
library(animation)

png(file="bernoulli%02d.png", width=600, height=300)
for (i in 1:5)
 {
 plot(rbinom(nobs,n,p),type="h",font=2,font.lab=2,xlab="Days",ylab="(0,1)")
 }
dev.off()

# Combine the png files saved in the folder into a GIF #

library(magick)

bernoulli_png1 <- image_read("bernoulli01.png","x150")
bernoulli_png2 <- image_read("bernoulli02.png","x150")
bernoulli_png3 <- image_read("bernoulli03.png","x150")
bernoulli_png4 <- image_read("bernoulli04.png","x150")
bernoulli_png5 <- image_read("bernoulli05.png","x150")

frames <- image_morph(c(bernoulli_png1, bernoulli_png2, bernoulli_png3, bernoulli_png4, bernoulli_png5), frames = 10)
animation <- image_animate(frames)

image_write(animation, "bernoulli.gif")

This is how the final GIF looks. Each frame is a simulation from the Bernoulli distribution. Depending on what version of R you are using, there may be more straightforward functions to create GIF.

Binomial Distribution

From the above, if you are interested in the number of successes (1s) in n trials, this number follows a Binomial distribution. If you assume X is a random variable that represents the number of successes in a Bernoulli sequence of n trials, then this X should follow a binomial distribution.

The number of trials is n = 181. The number of successes (getting a ticket) can be between 0 (if there are no tickets in all the 181 days) or 181
(if there is a ticket issued every day).

In R, the probability that this random variable X takes any value k (between 0 and 181), i.e., the probability of exactly k successes in n trials is computed using the command “dbinom.”

For computing the probability of exactly ten tickets in 181 days we can input:

px = dbinom(10,181,p)

For computing the probability of exactly 20 tickets in 181 days we can input:

px = dbinom(20,181,p)

To compute this probability for all possible k‘s and visualizing the probability distribution, we can use the following lines:

n = 181 # define the number of trials 
p = 0.15 # probability of the event 
x = 0:181 # number of successes varying from 0 to 181

px = dbinom(x,n,p)

plot(x,px,type="h",xlab="Random Variable X (Number of tickets in 181 days)",ylab="Probability P(X=k)",font=2,font.lab=2)

Do you know why the probability distribution is centered on 27? What is the expected value of a Binomial distribution?

If we want to compute the probability of getting more than five tickets in one month (30 days), we first calculate the probability for k = 6 to 30 (i.e., for exactly 6 tickets in 30 days to exactly 30 tickets in 30 days) with n = 30 to represent 30 trials.

n = 30 # define the number of trials 
p = 0.15 # probability of the event 
x = 6:30 # number of successes varying from 6 to 30

px = dbinom(x,n,p)
sum(px)

We add all these probability since
P(More than 5 in 30) = P(6 in 30) or P(7 in 30 ) or P(8 in 30) …

P(X > 5 in 30) = P(X = 6 in 30) + P(X=7 in 30) + ... + P(30 in 30).
Slightly advanced plotting using animation and GIF (for those more familiar with R)

I want to experiment with different values of p and check how the probability distribution changes.

I can use the animation and GIF trick to create this visualization.

Run the following lines in your code and see for yourself.

######## Animation #########
# Create png files for Binomial distribution #

png(file="binomial%02d.png", width=600, height=300)

n = 181
x = 0:181

p = 0.1
for (i in 1:5)
{
 px = dbinom(x,n,p)
 
 plot(x,px,type="h",xlab="Random Variable X (Number of tickets in 181 days)",ylab="Probability P(X=k)",font=2,font.lab=2)
 txt = paste("p=",p,sep="")
 text(150,0.04,txt,col="red",cex=2)
 p = p+0.2
}
dev.off()

# Combine the png files saved in the folder into a GIF #

library(magick)

binomial_png1 <- image_read("binomial01.png","x150")
binomial_png2 <- image_read("binomial02.png","x150")
binomial_png3 <- image_read("binomial03.png","x150")
binomial_png4 <- image_read("binomial04.png","x150")
binomial_png5 <- image_read("binomial05.png","x150")

frames <- image_morph(c(binomial_png1, binomial_png2, binomial_png3, binomial_png4, binomial_png5), frames = 15)
animation <- image_animate(frames)

image_write(animation, "binomial.gif")

You can also try changing the values for n and animate those plots.

We will return next week with more R games for the Geometric distribution, Negative Binomial distribution, and the Poisson distribution.

Meanwhile, did you know that RocketMan owes NYC $156,000 for unpaid parking tickets?

If you find this useful, please like, share and subscribe.
You can also follow me on Twitter @realDevineni for updates on new lessons.

error

Enjoy this blog? Please spread the word :)