Lesson 57 – My name is Maximus Extremus Distributus

The best school districts in New York have a name.

The name’s Extremus Distributus.

Heavy damaging winds have a name.

Extremus Distributus.

Central limit theorem tells you that the mean of the normal distribution follows a normal distribution in the limit.

Centerus Normalus Distributus.

The maxima of normal distribution also follow a distinct distribution.

Maximus Extremus Distributus

The maxima of several other distributions also follow a Maximus Extremus Distributus.

Tertia pars sequetur …

If you find this useful, please like, share and subscribe.
You can also follow me on Twitter @realDevineni for updates on new lessons.

Lesson 54 – The Bernoulli gene

D: That thought you have going must be bothering you. It gave you a long face.

J: Hello. Yes, it is bugging me. We are racing ahead with the lessons, rolling on one distribution after another. I follow each lesson and can understand the distributions as they are. But there are many, and I am guessing these are just the major ones we are learning. How do I make sense of them? Is there any way to summarize the distributions we learned so far?

D: Hmm. If I tell you that there is a Bernoulli connection to the major distributions we learned, can you trace it back?

J: I am not following.

D: Okay, let’s try this. I will show you a graphic that connects the distributions we learned thus far. Can you work with me to trace the links? That will be an efficient way, both to summarize and remember the distributions.

J: I like the thought and the exercise. Let’s do it. Show me the graphic.

D: Here. I put the distributions in one place and connected the dots. It’s a high-resolution image. Click on it to open a full page graphic. I want you to walk me through it.

J: Cool. The Bernoulli trial (0 1) is the origin. Lesson 31. There are two possibilities; event occurred – success or event did not occur – failure. There is a sequence (Bernoulli gene code) of 0’s and 1’s (010110010000), n Bernoulli trials. There is a probability of occurrence of p that is constant over all the trials, and the trials are assumed to be independent.

D: Good. Now, what is the first distribution we learned?

J: The binomial distribution. Lesson 32. The number of successes in a Bernoulli sequence of n trials is a binomial distribution.

D: Correct. Can you write down the probability distribution function for the Binomial distribution?

J: Sure.  P(X = x) = \frac{n!}{(n-x)!x!}p^{x}(1-p)^{n-x}

D: Now, refer to the recent lesson we did on the normal distribution and the central limit theorem. It is lesson 48.

J: Ah, I see how you connected the Binomial to the Normal distribution in the graphic. The Binomial distribution can be estimated very accurately using the normal density function. I went through the looong derivation you had.

 P(X = x) = \frac{n!}{(n-x)!x!}p^{x}(1-p)^{n-x} = f(x) = \frac{1}{\sqrt{2 \pi \sigma^{2}}} e^{\frac{-1}{2}(\frac{x-\mu}{\sigma})^{2}}

Then, from the recent lessons, I know that the standard normal, the log-normal and the Chi-square distributions are transformations of the normal distribution.

The standard normal distribution is derived by subtracting from the distribution X, the mean (\mu) and dividing by the standard deviation (\sigma). Lesson 50.

 Z = \frac{X - \mu}{\sigma}

 Y = e^{Z} is a log-normal distribution because the log of Y is normal, standard normal. Lesson 52.

Last week was Chi-square distribution. Lesson 53. If Z follows a normal distribution, then, \chi = Z^{2} is a Chi-square distribution with one degree of freedom. If there are n standard normal random variables, Z_{1}, Z_{2}, ..., Z_{n} , their sum of squares is a Chi-square distribution with n degrees of freedom.

\chi = Z_{1}^{2}+Z_{2}^{2}+ ... + Z_{n}^{2}

I now see the flow from Bernoulli to Binomial to Normal to Standard Normal to Log-normal and Chi-square. Amazing how deep the Bernoulli gene code is.

D: Indeed. Now go through the rest of the graphic. You will see the connections of the other distributions.

J: Yes. I am looking at the Poisson distribution now. If we are counting the number of 1’s of the Bernoulli sequence in an interval, then these counts follow a Poisson distribution. Lessons 36 and Lesson 37.

P(X = x) = \frac{e^{-\lambda t}(\lambda t)^{x}}{x!}

\lambda is the rate of occurrence; the average number of 1’s per interval. This function is derived as an approximate function from the Binomial distribution with a large number of trials in an interval. Lesson 37.

D: That is correct. Now, do you remember how the Poisson distribution is connected to the Exponential distribution?

J: Yes. The Poisson distribution represents the number of events in an interval of time, and the exponential distribution represents the time between these events.

The time to arrival exceeds some value t, only if N = 0 within t, i.e., if there are no events in an interval [0, t].

P(T > t) = P(N = 0) = \frac{e^{-\lambda t}(\lambda t)^{0}}{0!} = e^{-\lambda t}

The probability density function f(t) is

f(t) = \frac{d}{dt}F(t) = \frac{d}{dt}(1-e^{-\lambda t}) = \lambda e^{-\lambda t}

Let me keep going.

On the discrete sense, if you measure the number of trials it takes to see the next 1 in the Bernoulli sequence, then it is a Geometric distribution. Lesson 33.

P(1^{st} \hspace{5}1\hspace{5}on\hspace{5} k^{th}\hspace{5}trial) = (1-p)^{k-1}p

The exponential distribution is the continuous analog of the discrete Geometric distribution.

Sticking to that thought, if we measure the trials or time to r^{th} 1 or event, we are looking at the Negative Binomial distribution (Lesson 35) for discrete and Gamma distribution (Lesson 45) for the continuous case.

P(r^{th} \hspace{5}1\hspace{5}on\hspace{5} k^{th}\hspace{5}trial) = \binom{k-1}{r-1}(1-p)^{k-r}p^{r} for the Negative Binomial, and

 f(t) = \frac{\lambda e^{-\lambda t}(\lambda t)^{r-1}}{(r-1)!} for the Gamma distribution.

The time to ‘r’th arrival T_{r} = t_{1} + t_{2} + t_{3} + ... + t_{r} , (sum of exponentials) and we derived the probability density function (Gamma) of T_{r} using the convolution of the individual exponential random variables  t_{1}, t_{2}, ... t_{r}.

Like the Geometric and Exponential, the Negative Binomial and Gamma are discrete and continuous analogs.

D: And, what did we learn last week about Chi-square?

J: That its probability density function is a Gamma density function with \lambda=1/2 and r=n/2.

f(\chi)=\frac{\frac{1}{2}*(\frac{1}{2} \chi)^{\frac{n}{2}-1}*e^{-\frac{1}{2}*\chi}}{(\frac{n}{2}-1)!} for \chi > 0 and 0 otherwise.

Wow. 

D: See how it all comes together. Bernoulli gene is running through the distribution line to connect them.

J: Yes. I can see that very clearly, now that I walked through each one in this order. Thank you for creating this fantastic graphic. It helps me in remembering the distributions.

D: You are welcome. Anything to make data analysis easy and fun.

J: What is up next? I am Filled with new energy.


Dust off your computer. We will learn some tricks in R for the continuous distributions. Time to crank some code.


If you find this useful, please like, share and subscribe.
You can also follow me on Twitter @realDevineni for updates on new lessons.

Lesson 53 – Sum of squares: The language of Chi-square distribution

The conversations with people at the local bar last night were the usual local and national politics. I usually join the pool table after a casual drink. Yesterday, upon the request of an old friend, I toyed with the game of darts.

In my heyday, I used to be good at this, so without much trouble, I could hit the bullseye after getting my sight.

Maybe it is the draught that did the trick. I felt jubilant.

A couple of tequilas and a few minutes later, I hoped to beat my previous record.

“Did you change the darts?”, “There’s something in my eye,” “Maybe they moved the target.” These were circling in my mind after my performance.

They did not move the target, they did not change the darts, but there was indeed something in my head. I decided to stop playing the next round and go home, lest someone else becomes the bullseye.

While heading back, I thought about how far off I was from the bullseye (origin). On the X-Y coordinate plane, the distance from origin is R=\sqrt{X^{2}+Y^{2}} .

The squared distance is R^{2}=X^{2}+Y^{2}.

It varies with each try. Random variable.

Today morning, while catching up on my news feed, I noticed this interesting article.

The article starts with a conversation between fans.

People bet millions on heads vs. tails. 

“…the toss is totally biased.” It reminded me of the famous article by Karl Pearson, “Science and Monte Carlo” in the fortnightly review published in 1894. He experimentally proved that the roulette wheels in Monte Carlo were biased.

He computed the error (observed – theoretical) (or squared error) and showed that the roulette outcomes in Monte Carlo could not happen by chance. He explained this based on two sets of 16,500 recorded throws of the ball in a roulette wheel during an eight week period in summer of 1892, manually, I may add. Imagine counting up 33,000 numbers, and performing various sets of hand calculations.

He also writes that he spent his vacation tossing a shilling 25,000 times for a coin-toss bias experiment.

These experiments led to the development of the relative squared error metric, the Pearson’s cumulative test statistic (Chi-square test statistic).

Some excerpts from his concluding paragraph.

“To sum up, then: Monte Carlo roulette, if judged by returns which are published apparently with the sanction of the Societe, is, if the laws of chance rule, from the standpoint of exact science the most prodigious miracle of the nineteenth century.

we are forced to accept as alternative that the random spinning of a roulette manufactured and daily readjusted with extraordinary care is not obedient to the laws of chance, but is chaotic in its manifestation!

By now you might be thinking, “What’s the point here. Maybe it’s his hangover writing.”

Hmm, the square talk is for the Chi-square distribution.

Last week, we visited Mumble’s office. He has transformed the data — log-normal distribution.

If Z follows a normal distribution, then, X = e^{Z} is a log-normal distribution because log of X is normal.

Exponentiating a normal distribution will result in log-normal distribution.

See for yourself, how Z \sim N(0,1) tranforms into X, a log-normal distribution. X is non-negative.

Similarly, squaring a normal distribution will result in a Chi-square distribution.

If Z follows a normal distribution, then, \chi = Z^{2} is a Chi-square distribution with one degree of freedom.

See how the same Z \sim N(0,1) tranforms into \chi, a Chi-square distribution, again non-negative, since we are squaring.

Let’s derive the probability distribution function for the Chi-square distribution using the fact that \chi = Z^{2}. We will assume Z is a standard normal distribution Z \sim N(0,1).

For this, we will start with the cumulative distribution function, F(\chi) and take its derivative to obtain the probability distribution function f(\chi) since f(\chi)=\frac{d}{d\chi}F(\chi).

\chi = Z^{2}

F(\chi) = P(\chi \le \chi) is the cumulative distribution function.

F_{\chi}(\chi) = P(Z^{2} \le \chi)

=P(-\sqrt{\chi} \le Z \le \sqrt{\chi})

=P(Z \le \sqrt{\chi}) - P(Z \le -\sqrt{\chi})

F_{\chi}(\chi) =F_{Z}(\sqrt{\chi}) - F_{Z}(-\sqrt{\chi})

f_{\chi}(\chi)=\frac{d}{d\chi}(F_{\chi}(\chi))

=\frac{d}{d\chi}(F_{Z}(\sqrt{\chi}) - F_{Z}(-\sqrt{\chi}))

Applying the fundamental theorem of calculus and chain rule together, we get,

=f_{Z}(\sqrt{\chi})*\frac{1}{2\sqrt{\chi}} + f_{Z}(-\sqrt{\chi})*\frac{1}{2\sqrt{\chi}}

=\frac{1}{2\sqrt{\chi}}*(f_{Z}(\sqrt{\chi})+f_{Z}(-\sqrt{\chi}))

By now, you are familiar with the probability distribution function for Z. f_{Z}(z) = \frac{1}{\sqrt{2\pi}}e^{\frac{-z^{2}}{2}}. Let’s use this.

f_{\chi}(\chi)=\frac{1}{2\sqrt{\chi}}*(\frac{1}{\sqrt{2\pi}}e^{\frac{-(\sqrt{\chi})^{2}}{2}}+\frac{1}{\sqrt{2\pi}}e^{\frac{-(-\sqrt{\chi})^{2}}{2}})

f_{\chi}(\chi)=\frac{1}{\sqrt{2 \pi \chi}}e^{\frac{-\chi}{2}} for \chi > 0.

As you can see, the function is only defined for \chi > 0. It is 0 otherwise.

With some careful observation, you can tell that this function is the Gamma density function with \lambda=\frac{1}{2} and r = \frac{1}{2}.

Yes, I know, it is not very obvious. Let me rearrange it for you, and you will see the pattern.

f(\chi) = \frac{1}{\sqrt{2 \pi \chi}}e^{-\frac{1}{2}\chi}

=\sqrt{\frac{1}{2}}*\sqrt{\frac{1}{\chi}}*\frac{1}{\sqrt{\pi}}*e^{-\frac{1}{2}\chi}

=\frac{(1/2)^{1/2}(\chi)^{-1/2}e^{-\frac{1}{2}\chi}}{\sqrt{\pi}}

Multiply and divide by 1/2.

=\frac{(1/2)*(1/2)^{1/2}*(\chi)^{-1/2}*e^{-\frac{1}{2}\chi}}{(1/2)\sqrt{\pi}}

=\frac{(1/2)*(1/2)^{-1/2}*(\chi)^{-1/2}*e^{-\frac{1}{2}\chi}}{\sqrt{\pi}}

If \lambda=1/2

f(\chi)=\frac{\lambda*(\lambda \chi)^{-1/2}*e^{-\lambda*\chi}}{\sqrt{\pi}}

Drawing from the factorial concepts, we can replace \sqrt{\pi} with (1/2)! or (-1/2)!, which means, r = 1/2

f(\chi)=\frac{\lambda*(\lambda \chi)^{r-1}*e^{-\lambda*\chi}}{(r-1)!}

This equation, as you know is the density function for the Gamma distribution.

So, Chi-square density function is Gamma density function with \lambda=1/2 and r=1/2. It is a special case of the Gamma distribution.

Now let’s up a level. Sum of squares of two standard normals, like our squared distance (X^{2}+Y^{2}).

\chi = Z_{1}^{2} + Z_{2}^{2}.

We know from lesson 46 on convolution that if X and Y are two independent random variables with probability density functions f_{X}(x) and f_{Y}(y), their sum Z = X + Y is a random variable with a probability density function f_{Z}(z) that is the convolution of f_{X}(x) and f_{Y}(y).

f(z) = f_{X}*f_{Y}(z) = \int_{-\infty}^{\infty}f_{X}(x)f_{Y}(z-x)dx

We can use the principles of convolution to derive the probability density function for \chi = Z_{1}^{2} + Z_{2}^{2}.

Let’s assume Z_{1}^{2}=k. Then, Z_{2}^{2}=\chi - k, and

f_{\chi}(\chi)=\int_{-\infty}^{\infty}f_{Z_{1}^{2}}(k)f_{Z_{2}^{2}}(\chi - k)dk

f_{Z_{1}^{2}} = \frac{1}{\sqrt{2 \pi k}}e^{-\frac{k}{2}}. This is the same function we derived above for \chi = Z^{2}. Using this,

f_{\chi}(\chi)=\int_{-\infty}^{\infty}\frac{1}{\sqrt{2 \pi k}}e^{-\frac{k}{2}}\frac{1}{\sqrt{2 \pi (\chi - k)}}e^{-\frac{(\chi - k)}{2}}dk

=\frac{1}{2\pi}\int_{0}^{\chi}k^{-\frac{1}{2}}e^{-\frac{k}{2}}(\chi - k)^{-\frac{1}{2}}e^{-\frac{(\chi - k)}{2}}dk

=\frac{1}{2\pi}e^{-\frac{\chi}{2}}\int_{0}^{\chi}k^{-\frac{1}{2}}(\chi - k)^{-\frac{1}{2}}dk

The term with the integral integrates to 2*arcsin(\frac{\sqrt{k}}{\sqrt{\chi}}), and its definite integral is \pi since arcsin(1) = \frac{\pi}{2}. Try it for yourself. Put your calculus classes to practice. 

We are left with

f_{\chi}(\chi) = \frac{1}{2}e^{-\frac{\chi}{2}}, again for \chi > 0.

This function is a Gamma distribution with \lambda = \frac{1}{2} and r = 1.

Generalization for n random normal variables

If there are n standard normal random variables, Z_{1}, Z_{2}, ..., Z_{n}, their sum of squares is a Chi-square distribution with n degrees of freedom.

\chi = Z_{1}^{2}+Z_{2}^{2}+ ... + Z_{n}^{2}

Its probability density function is a Gamma density function with \lambda=1/2 and r=n/2. You can derive it by induction.

f(\chi)=\frac{\frac{1}{2}*(\frac{1}{2} \chi)^{\frac{n}{2}-1}*e^{-\frac{1}{2}*\chi}}{(\frac{n}{2}-1)!} for \chi > 0 and 0 otherwise.

Look at this animation for Chi-square distribution with different degrees of freedom. See how it becomes more symmetric for large values of n (degrees of freedom).

We will revisit the Chi-square distribution when we learn hypotheses testing. Till then, the sum of squares and error square should remind you of Chi-square [Square – Square], and tequila square should remind you of

If you find this useful, please like, share and subscribe.
You can also follow me on Twitter @realDevineni for updates on new lessons.

Lesson 52 – Transformation: The language of lognormal distribution

A cluttered desk with scattered papers, piles of binders, and an open reference textbook with a pencil on top welcomes Mumble to his day at work.

“Clean up the workspace,” said Mumble in angst, staring at the checklist for the day. It was that time of February when his last New Year resolution of having an ambient workspace had already taken a backburner.

He has two essential data analysis tasks and two meetings for the day. Besides, he set himself two chores. If you think Mumble is doing his miscellaneous tasks at works, you are mistaken. He is like you and me when it comes to writing checklists.

He begins his first task: Analyze flood damage data.

The 2017 flood insurance claims are starting to come in. Mumble, who was the chief designer of the product was assigned the task of corroborating the flood damage claims with the reported flood damage data. He was also assigned the task of estimating the probability of damage exceeding a certain threshold set for the year by the company.

“Open Dartmouth Flood Observatory Database. They will have the archive for recent floods, the area affected and people displaced. I can use that data to verify if the claims from these areas are valid or not,” thought Mumble as he types his password to log in.

“Time for some coding and analysis. The best part of my day. Fire up RStudio. Check. Read the file into R workspace. Check.” He completes the essentials and is now ready to analyze the data. You can also look at the data if you want.

“Let me first filter the database to select and plot only the floods for 2017.” RStudio lets him make the map too.

“Aha. The locations match the countries from where we got the claims. So let me look at the data for people displaced and develop the probability distribution function for it.” He quickly types up a few lines of code as he sips his coffee.

“There are 123 events,” he thinks as he scrolls down his monitor. “Some of these floods must be minor. There are 0’s, no people displaced in 40 such events. There are some huge numbers though. Possibly created a lot of damage. Let me plot them to see their arrangement on the number line.”

“They do not look symmetric. The few large numbers are skewing the data. I wonder how the frequency plot will look.”

“Ugly. Not sure what probability distribution fits this data. Those large numbers are dominating, but they are also most of the insurance claims.” He took another sip, leaned back, and with his hands at the back of his head, stared at the ceiling.

After about 30 seconds, it struck him that the scale of the observations is obscuring the pattern in the data.

What if I transform the data? If I re-express the data on a different scale, I can perhaps alter the distances between the points. Log scale?”

So he applied log transformation y = log(x) and plotted their frequency.

“Amazing. A simple mathematical transformation can make a skewed distribution more symmetric. The application of “logarithm” has shrunk the large numbers on the right side and moved them closer to the center. The frequency plot looks like a normal distribution, ” he thought, as he typed another line into the code to update the plot.

He realized that the log of the data is a normal distribution. “Lognormal distribution,” he said.

If Y = log(X) is a normal distribution with mean \mu_{y} and standard deviation \sigma_{y}, then X follows a lognormal distribution with a probabilty density function

f(x) = \frac{1}{x} \frac{1}{\sqrt{2\pi\sigma_{y}^{2}}} e^{\frac{-1}{2}(\frac{ln(x)-\mu_{y}}{\sigma_{y}})^{2}}

Remember, \mu_{y} and \sigma_{y} are the mean and standard deviation of the transformed variable Y.

The parameters (mean \mu_{x} and the standard deviation \sigma_{x}) of X are related to \mu_{y} and \sigma_{y}.

\mu_{x}=e^{\mu_{y}+\frac{\sigma_{y}^{2}}{2}}

\sigma_{x}^{2}=\mu_{x}^{2}(e^{\sigma_{y}^{2}}-1)

From \sigma_{x}^{2}=\mu_{x}^{2}(e^{\sigma_{y}^{2}}-1), we can also deduce that \sigma_{y}^{2}=ln(1+CV_{x}^{2}). CV_{x} is the coefficient of variation of the lognormal variable X. You may recall from Lesson 20 that coefficient of variation is the ratio of the standard deviation and the mean. CV_{x}=\frac{\sigma_{x}}{\mu_{x}}.

You must have noticed already that the probabilities can be computed using the transformed variable (Y) and the usual method of standard normal distribution, i.e., convert y to z using z = \frac{y-\mu_{y}}{\sigma_{y}}=\frac{ln(x)-\mu_{y}}{\sigma_{y}}

P(X \le x)=P(e^{Y} \le x)=P(Y \le ln(x))=P(Z \le \frac{ln(x)-\mu_{y}}{\sigma_{y}})

“So the lognormal distribution can be used to model skewed and non-negative data.” He sits up in his chair excited, types a few lines of code with enthusiasm and write down the following in his notepad for the meeting later.

 P(Displaced > 300,000) = 0.0256

Can you tell how?

He then plots the flood-affected area using similar plots.

“Hmm, the original data is skewed with a large affected area to the right. But, the log-transformed data is not symmetric. It looks like there are numbers to the left that are far away from the log-transformed data.” He keeps staring at his screen as Aaron knocks on the door. “Meet now?”

“Sure.” Mumble walks out with his notepad and few other things. The flood-affected area plot is still pestering him, but he needs to take care of other issues for the day.

“Maybe logarithm is one type of transformation. Maybe there are other transformations?” He keeps thinking during his meetings.

As his 3 pm meeting comes to an end, he still has to do quality checks on the claims data. As is usual, his checklist stays incomplete. The filing taxes just got moved to the next day. He was however resolute to catch up on Transformers before Bumblebee hits the theaters this year. So transformers is on for the evening. It is timely as he transforms the data.

If you find this useful, please like, share and subscribe.
You can also follow me on Twitter @realDevineni for updates on new lessons.

Lesson 51 – Sometimes it is important to let the data speak

On the fifth day of February 2017, I embarked upon this journey to create a platform to make data analysis easy for at least a million people. When I began, and even now, I am no expert in this field. Over the years, I have learned several concepts from my mentors and other masters, and I believe I am only a conduit for sharing those with you.

Today, the fourth day of February 2018 marks the one-year milestone for us. We crossed 50,000 page views from more than 10,000 users across 136 countries. I hope my mission is underway and I have created interest in you towards data analysis 🙂

As a landmark event, I asked my mentor, Prof. Upmanu Lall from Columbia University in the City of New York to give us a lesson. He was gracious enough to agree and has taken time out of his ever busy schedule to teach us that “sometimes it is important to let the data speak.”

The man who has pioneered non-parametric methods for hydrology himself opens us to kernel density, why and what.

So, here is his gift on the occasion of our celebration of one-year together; or should I say,

Sometimes it is important to let the Master speak.

Sometimes it is important to let the data speak…

by

Founded in 1670, Charleston is the oldest and largest city in S. Carolina. For such a historic city and the surrounding community, reliable water supply is critical. Jill is the city manager. Charleston’s had a series of droughts in recent years, and the City Council wants to know how unusual these are, so they can think about investments to manage or capture water in the wettest months and have it available in the drier months.

Jill asked Jack, the comptroller to come up with a presentation so they could understand the situation. Jack was able to locate monthly rainfall data from 1893, and given over a 100 years of data felt that he could indeed present some ideas. After looking over the data, he first plotted a wet (June) and a dry month (January) to see how the rain changed across years.

A remarkable range of variation shows up especially in June, with many years with nearly zero rain, and others with as much as 15 inches of rain. On the other hand, the rainfall in January rarely exceeds 5 inches.

Jack first asked the question “How much rain can you count on in each of these months 10, 25, 50, 75 or 90% of the years”? The idea was to see how this compares with the amount of rain one would need to fall in each of the months to meet water needs that occur in that month.

This demand could change depending on how many people live in Charleston, and the collection area for water supply. Since the council could come up with different assumptions as to the future population or demand, Jack thought it would be wise to present his arguments using the rainfall needed per person, and the rainfall available per person.

Jack’s first take on this question was to pull together the January (June) data and re-arrange it from the smallest to the largest value for that month – using the 1893-2016 data. This was 124 values that are arranged from the lowest to the highest. Sorting the data this way let Jack identify the driest and the wettest years at a glance, and also to quickly do the calculation he was looking for.

Since Jack is R savvy, he actually just did this operation in R, using the quantile function, which reports the quantiles or percentiles of the data.

Looking at this, Jack could see that 10% of the time the rain could be less than 0.7 (1.47) inches and as much as 3.99 (6.79) inches in January (June).

He immediately wondered whether the June rainfall was likely to be low (high) in the same year that the January rainfall was high(low). Looking at their plot, it looked highly unlikely that there was a pattern. The calculated correlation was -0.03 confirming the plot.

Since presenting tables of numbers to a city council is never too exciting, Jack decided to present his findings graphically.

Again, being R savvy, he plotted the cumulative distribution function for the rain for each month.

The cumulative distribution function is just an estimate of the fraction of observations that are smaller than a given number – for instance for January (June), if we were curious about what the rainfall amount would be such that 50% of the values or a fraction 0.5 were smaller than these amounts, we could look that up with a value of the cumulative distribution function of 0.5, and find that it would be a rainfall amount of 1.95 (3.48) inches of rain.

The cumulative distribution function is then just a plot of the quantiles.

We see this in the figure below. For each of the quantiles Jack had calculated, he dropped blue (red) lines to show the corresponding rainfall for January (June). It is then easy to see that for each quantile the rain in January is less than the rain in June – both from the vertical lines and the cumulative distribution function curves.

Now refer back to Lesson 50. There the symmetry of the Normal distribution was talked about, and the area under the Normal density function between two rainfall values was interpreted as the percentage of time the values could fall in that range. We see some parallels.

If we are interested in the Probability that the January rainfall is less than 1.95 (P(Rain_{january} \le 1.95)), we see that this is 0.5, and for the Normal distribution this would be the area from –infinity (or really 0) rain to 1.95.

We also saw that the Normal distribution is symmetric. This would suggest that the areas to a distance left of the mean (median or the 50th percentile for the normal distribution is the same as the mean since it is a symmetric function) are the same as the areas the same distance right of the mean. Does that seem to hold for the Charleston rainfall?

These don’t really look symmetric.

Normally, the reason to use a model such as the Normal distribution is that we don’t have much data (e.g., 30 years) and if I am interested in a 100 year event (i.e. something that would occur on average once in a 100 years), unless I fit a probability model to it, I really cannot say anything about a 100 year event.

So, Jack wanted to make sure that even though he had 124 years of data, he was not challenged by a statistically savvy city council model for not fitting a probability distribution model, which if it is the right one, maybe more reliable.

So far, it doesn’t look promising to use a Normal distribution model. This is not a surprise since rainfall cannot be negative and we have so many years in which it is close to zero. In fact, the average rain in January (June) is 2.24 (4.04) inches compared to a maximum of 6.29 (16.29) inches over the 124 years. So, the data is definitely not symmetric, and the Normal distribution would not be a good choice.

Sometimes, people will argue that the logs of the data could be Normally distributed, since after taking logs, small positive values can be negative, so Jack thought he would check that out too. Here is what he found after taking logs of the rainfall data.

Now there was a bit of a dilemma. Comparing Min, Mean and Max, it seems that the data is not at all symmetric.

(Mean-Min) = 2.42 (62) vs Max-Min = 1.26 (1.62).

But the min and the max may not be the best way to look at this since these are rare values and may not always be symmetric, just if one anomalous value was recorded. So Jack also checked the symmetry across the quantiles.

Still not quite there 🙄

Finally, just to reassure himself, Jack used R to plot what the data for each month looked like along with the best fit of a Normal distribution, an exponential distribution (recommended for rainfall in a book), and also a kernel density plot.

The monthly rainfall values are plotted in red; the exponential distribution fit in blue; the normal distribution fit in green; and the kernel density plot in black.

For the original scale

For the LOG scale 

Looking at these plots for the original and the log-transformed data Jack was quite clear that the normal and the exponential models were very different from the kernel density plot and if the kernel density represents what the probability density of the data really looks like then one could not use the normal or the exponential model with the original data or the logs.

So what is a kernel density plot?

Aha – this needs a few lessons to master, but for now, think of it as a plot where the probability density of the variable – rainfall in our case – is estimated for any rainfall value (say rain = 3″) by looking at how many rainfall observations fell within a window of a given size (e.g., 1″) centered at the value of interest (3″).

So, the idea is that if a lot of values are close to 3″ then the probability density is high there, and conversely, if there are very few values then the probability density is low there. The result will clearly depend on the size of the window.

Also, observations that are far from the target should perhaps not be considered representative of the current value and should be down-weighted.

The weight or kernel function is then a function of the distance from the target. A common kernel function is the Normal distribution centered at each point at which an estimate is desired, with a certain specified standard deviation which functions as a window width.

For instance to estimate the density at rain =3″, we may use a Normal density function with mean equal to 3 and a standard deviation of 1. The density is then computed as the sum of the contribution of all observations at that point using this kernel.

f(x)=\frac{1}{nh}\sum_{i=1}^{n}K(\frac{x-x_{i}}{h})

u=\frac{x-x_{i}}{h}

K(u) = \frac{1}{\sqrt{2\pi}} e^{-\frac{u^{2}}{2}}

You can see that the kernel function K(u) looks like a Normal distribution with mean 0 and standard deviation equal to 1. Of course, comparing with Lesson 50, looking at the definition of u it is easy to see that the mean is x_{i} and the standard deviation is h.

Another way to interpret these equations is that the kernel density estimate at x is the weighted contribution of all observations x_{i} as being representative of what we expect at x. The weights are from the Normal distribution centered at x.

Thus, this is like doing a weighted moving average that is computed by moving from one value of x to another. As we can see from the figures for Charleston, the result does not look like a Normal distribution that is fit to the full data.

More on this later…

If you find this useful, please like, share and subscribe.
You can also follow me on Twitter @realDevineni for updates on new lessons.

Lesson 50 – The Standard Normal

Tom works in FedEx. He is responsible for weighing the parcels and estimating the cost of shipping. He verified the previous data on daily packages and found that the probability distribution resembled a normal distribution with a mean of 12 lbs and standard deviation of 3.5 lbs. There is an extra charge if the package weighs more than 20 lbs. Tom wants to know the probability that the parcels he weighs are within 20 lbs.

 P(X \le 20) = \int_{-\infty}^{20}\frac{1}{\sqrt{2 \pi 3.5^{2}}} e^{\frac{-1}{2}(\frac{x-12}{3.5})^{2}}dx

Perhaps you can help Tom. Did you solve the integral of the normal density function from last week?

Dick is excited to start his first job as a construction site engineer for H&H Constructions. He was told that the pH of the soil on this site follows a normal distribution with a mean pH of 6 and a standard deviation of 0.1. Yesterday he collected a soil sample with the following question in mind: “what is the probability that the pH of this soil sample is between 5.90 and 6.15?

 P(5.90 \le X \le 6.15) = \int_{5.90}^{6.15}\frac{1}{\sqrt{2 \pi 0.1^{2}}} e^{\frac{-1}{2}(\frac{x-6}{0.1})^{2}}dx

Can you answer Dick’s question? Did you solve the integral of the normal density function from last week?

Harry, a regular reader of our blog, is new at the Hamilton Grange. He has an idea to attract customers on Saturday. He suggested offering a free drink to anyone not seated within  x minutes. Mr. Hamilton thought this was a cool idea and agreed to offer free drinks to 1% of the customers.

Can you work with Harry to compute x, the wait time, after which the customers get a free drink?

Before you help Tom, Dick, and Harry, what is your experience trying to solve the integral  P(X \le x) = \int_{-\infty}^{x}\frac{1}{\sqrt{2 \pi \sigma^{2}}} e^{\frac{-1}{2}(\frac{x-\mu}{\sigma})^{2}}dx ?

Could you not solve it?

Hmm, don’t feel bad. A closed form integral for this function is impossible.

How then can we compute these probabilities?

I am sure you are now thinking about some form of a numerical integration method for the definite integral. Maybe the trapezoidal method.

Maybe. That is the point. You can approximate the integral with reasonable accuracy.

But don’t you think it is a bit tedious to do this each time there is a normal distribution problem involved?

Enter Z, the Standard Normal Distribution

Let’s travel back to lesson 28 where we learned standardizing the data.

We can move the distribution from its original scale to a new scale, the Z-scale.

This process of standardization can be achieved by subtracting from the distribution, the mean of the data and dividing by the standard deviation. We have seen that when we subtract the mean and divide by the standard deviation, the expected value and the variance of the new standardized variable is 0 and 1.

Z = \frac{X - \mu}{\sigma}

Z = \frac{X}{\sigma} - \frac{\mu}{\sigma}

Let’s find the expected value and the variance of this new random variable Z.

E[Z] = E[\frac{X}{\sigma}] - E[\frac{\mu}{\sigma}]

E[Z] = \frac{1}{\sigma}E[X] - E[\frac{\mu}{\sigma}]

E[Z] = \frac{\mu}{\sigma} - \frac{\mu}{\sigma}

E[Z] = 0

The expected value of the new standardized variable Z is 0. In other words, it is centered on 0.

Now, for the variance.

V[Z] = V[\frac{X}{\sigma}] + V[\frac{\mu}{\sigma}]

V[Z] = \frac{1}{\sigma^{2}}V[X] + 0

V[Z] = \frac{1}{\sigma^{2}}\sigma^{2}

V[Z] = 1

The variance of the new standardized variable Z is 1. The standard deviation is 1.

The Standard Normal Z has a mean of 0 and a standard deviation of 1.

We just removed the influence of the location (center) and spread (standard deviation) from the original distribution. We are moving it from the original scale to the new Z-scale.

What are the units of Z?

Tom’s distribution can be moved like this.

Dick’s and Harry’s normal distribution will also look like this Z after transforming.

Subtracting the mean will give anomalies, i.e., differences from the mean centered on zero. Positive anomalies are the values greater than the mean, and negative anomalies are the values less than the mean.

Dividing by the standard deviation will provide a scaling factor; unit standard deviation for Z.

A weight of 15.5 lbs will have a Z-score of 1; 12 + 1*(3.5).

A package with a weight of 8.5 lbs will have a Z-score of -1; 12 – 1*(3.5).

Hence, the standardized scores (Z-scores) are the distance measures between the original data value and the mean, the units being the standard deviation. A package with a weight of 15 lbs is 0.857 standard deviations right of the mean 12 lbs.

Now, look at Tom’s question. What is the probability that the parcels he weighs are within 20 lbs?

P(X \le 20)

Let’s subtract the mean and divide X by its standard deviation.

P(X \le 20) = P(\frac{X-\mu}{\sigma} \le \frac{20-12}{3.5})

P(X \le 20) = P(Z \le 2.285)

Dick’s question. What is the probability that the pH of this soil sample is between 5.90 and 6.15?

P(5.90 \le X \le 6.15) = P(\frac{5.90-6}{0.1} \le \frac{X-\mu}{\sigma} \le \frac{6.15-6}{0.1})

P(5.90 \le X \le 6.15) = P(-1 \le Z \le 1.5)

P(5.90 \le X \le 6.15) = P(Z \le 1.5) - P(Z \le 1)

Harry’s problem. Compute x, the wait time, after which 1% of the customers get a free drink.

P(X \ge x) = 1\% = 0.01

P(\frac{X-\mu}{\sigma} \ge \frac{x-20}{3.876}) = 1\% = 0.01

Harry knows that on Saturday night a customer’s wait time X for a table is normally distributed with a mean of 20 minutes and a standard deviation of 3.876 minutes.

P(Z \ge \frac{x-20}{3.876}) = 1\% = 0.01

For Tom and Dick, we are computing the probability. In the case of Harry, we are computing the value for x that will give a specific probability.

You must have observed that the common thread in all the cases is its transformation to the standard normal (Z).

In all the cases, it is sufficient to approximate the integral of Z numerically.

P(X \le 20) = P(Z \le 2.285) = \int_{-\infty}^{2.285}\frac{1}{\sqrt{2 \pi}} e^{\frac{-1}{2}(z)^{2}}dz

The standard normal tables you find in most appendices of statistics textbooks or online are the numerical integral approximations of the standard normal distribution Z. An example is shown here.

The first column z represents the standardized normal variable (z) and the columns after that represent the probability  P(Z \le z). Notice that at z = 0, P(Z \le z) = 0.5 indicating that  P(Z \le 0) is 50%.

The probability ranges from 0 to 0.999 for z = -3.4 to z = 3.4 as we move from left of the scale to the right. The first column is the random variable z, and the subsequent columns are the probabilities or the areas corresponding the values of z. This animation will make it clear.

Look at this example on how to read the probability for a z-score of 2.28, Tom’s case.

P(X \le 20) = P(Z \le 2.285) = 0.9887 .

Dick’s question. What is the probability that the pH of this soil sample is between 5.90 and 6.15?

Answer: 0.7745. Did you check?

Harry has to equate \frac{x-20}{3.876} to the Z-score that gives a probability of 0.99.

P(Z \ge \frac{x-20}{3.876}) = 1% = 0.01

P(Z \le \frac{x-20}{3.876}) = 1 - 0.01 = 0.99

\frac{x-20}{3.876} = 2.33.

Read from the table. The probability for a Z-score of 2.33 is 0.9901.

x = 20 + 2.33*3.876 = 29.03

You get a free drink if your seating wait time is greater than 29 minutes. 😉 Get the drink and continue to wait. It’s Saturday night on Amsterdam Avenue.

While you are waiting, think about the 68-95-99.7 rule of the normal distribution. Also, guess how many page views and users we have on our blog. We’ve traveled for close to a year now. Thank you so so much for this wonderful journey 🙂

If you find this useful, please like, share and subscribe.
You can also follow me on Twitter @realDevineni for updates on new lessons.

Lesson 49 – Symmetry: The language of normal distribution

Hello.

I am the normal distribution.

I am one of the most important density functions in probability. People are so used to me, almost to the point of using me for approximating any data.

You have seen in Lesson 47 and Lesson 48 that I am a good approximation for the distribution function of the sum of independent random variables. The Central Limit Theorem.

My functional form is

 f(x) = \frac{1}{\sqrt{2 \pi \sigma^{2}}} e^{\frac{-1}{2}(\frac{x-\mu}{\sigma})^{2}}

Did you notice I am merely a symmetric function e^{-x^{2}}, with some constants and parameters?
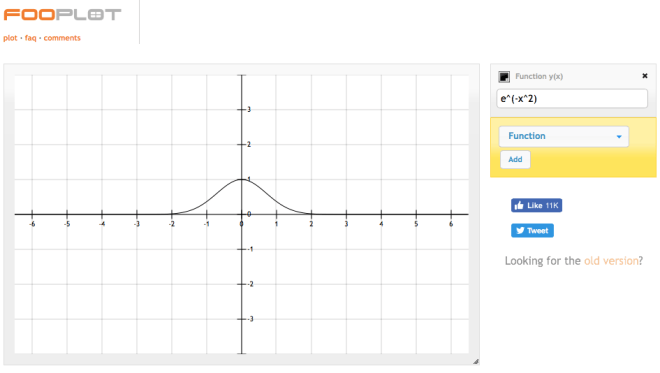
x can be positive or negative real numbers (continuous random variable)  -\infty < x < \infty .

\mu and \sigma are my control parameters.

Can you tell me what lesson was it where we learn that \mu is the mean or expected value and \sigma is the standard deviation of the distribution?

People use the notation N(\mu, \sigma) to say that I am a normal distribution with mean \mu and standard deviation \sigma.

\mu is my center. It can be positive or negative (-\infty < \mu < \infty), and the function is symmetric to its right and left. \sigma is how spread out I am from the center. It is positive (\sigma > 0).

Look at this example. I am centered on 60 and changing the spread. Narrow and wide flanks. Larger standard deviation results in a wider distribution with more spread around the mean.

In this example, I have the same spread, but I am changing my location (center).

I told you before that I am symmetric around the mean. So the following properties hold for me.

P(X > \mu) = P(X < \mu) = 0.5

P(X > \mu + a) = P(X < \mu - a)

f(\mu + a) = f(\mu-a)

By the way, if I give you the values for \mu and \sigma, do you know how to compute P(X \le x)?

You guessed it correct. Take my probability density function and integrate it from -\infty to x.

P(X \le x) = \int_{-\infty}^{x}\frac{1}{\sqrt{2 \pi \sigma^{2}}} e^{\frac{-1}{2}(\frac{x-\mu}{\sigma})^{2}}dx

For example,

Is this the cumulative distribution function  F(x)?

Compute the closed form solution of this integral.

P(X \le x) = \int_{-\infty}^{x}\frac{1}{\sqrt{2 \pi \sigma^{2}}} e^{\frac{-1}{2}(\frac{x-\mu}{\sigma})^{2}}dx

You can try change of variables method or the substitution method.

You can try integration by parts.

You can find the anti-derivative and use the fundamental theorem of calculus to solve.

I dare you to compute this integral to a closed form solution by next week.

We will continue our lessons after your tireless effort on this 😉

If you find this useful, please like, share and subscribe.
You can also follow me on Twitter @realDevineni for updates on new lessons.

Lesson 48 – Normal is the limit

What is this? Is it normal?

The shape is limited to a bell. Is it normal?

It is the same for any variable. Is it normal?

Why is it normal?

What is the normal?

The binomial distribution is the number of successes in n trials. It is the sum of n Bernoulli random variables.

S_{n} = X_{1} + X_{2} + ... + X_{n}, where  X_{i} \in (0,1) \hspace{5} \forall i

A mathematical approximation for the binomial distribution with a large number of trials is the Poisson distribution. We know that the average number of events in an interval ( \lambda ) is the expected number of successes np.

The wait time for the ‘r’th arrival follows a Gamma distribution. Gamma distribution is the sum of r exponential random variables.

 T_{r} = t_{1} + t_{2} + t_{3} + ... + t_{r}

What you observed in the animations last week, and what you saw now for the Binomial, Poisson, and Gamma as examples, is that the sum of random variables is tending towards a particular shape (distribution function).

This observation is “central” to probability theory.

It is called the Central Limit Theorem.

If S_{n} is the sum of  n independent random variables, then the distribution function of  S_{n} can be well-approximated by a continuous function knows as the normal density function given by

f(x) = \frac{1}{\sqrt{2 \pi \sigma^{2}}} e^{\frac{-1}{2}(\frac{x-\mu}{\sigma})^{2}}

where  \mu and \sigma^{2} are the expected value and variance of the original distribution.

It was first proved by a French mathematician Abraham de Moivre in the early 1700s. He showed this in one of the chapters of his thesis, The Doctrine of Chances. Page 243: “A Method of approximating the Sum of the Terms of the Binomial  (a+b)^{n} expanded into a Series, from whence are deduced some practical Rules to estimate the Degree of Assent which is to be given to Experiments.

An interesting observation from his thesis.

As you can see, he derived useful approximations to Binomial series. Imagine computing factorials for large values of n in those times.

It turns out that the binomial distribution can be estimated very accurately using the normal density function.

 f(x) = \frac{n!}{(n-x)!x!}p^{x}(1-p)^{n-x} = \frac{1}{\sqrt{2 \pi \sigma^{2}}} e^{\frac{-1}{2}(\frac{x-\mu}{\sigma})^{2}}

I compiled the modern version of this derivation. It is long with all the steps.

Please CLICK HERE to read and understand the details.

Follow it through the end. You will feel good to see how Binomial converges in the limit to this symmetric distribution.

Most probability distributions are related some way or the other to independent Bernoulli trails (the root events). If you carefully look at the probability distribution functions for each of them and take it to the limit as n \rightarrow \infty, you will see how the normal distribution emerges as the limiting distribution.

That is why it is normal.

The intuition from convolution

A very intuitive and elegant way of understanding the Central Limit Theorem and why the bell shape emerges due to convergence in the center of the distribution is provided in Chapter 9 (Preasymptotic and Central Limit in the Real World) of Silent Risk, technical notes on probability by Nassim Nicholas Taleb.

The gist is as follows.

We are deriving the distribution function for the summation of the random variables.

S_{n} = X_{1} + X_{2} + ... + X_{n}

You know from lesson 46 that this is convolution.

If X and Y are two independent random variables with probability density functions f_{X}(x) and f_{Y}(y), their sum Z = X + Y is a random variable with a probability density function f_{Z}(z) that is the convolution of f_{X}(x) and f_{Y}(y).

 f(z) = f_{X}*f_{Y}(z) = \int_{-\infty}^{\infty}f_{X}(x)f_{Y}(z-x)dx

Convolution is the multiplication of functions.

The probability distribution (for example, f_{Y}(z-x)) is weighted using another function (for example, f_{X}(x)). When we repeat this through induction, we smooth out the function at the center till it gets a bell-like shape and the tails become thin.

In Chapter 9, he provides an example convolution of uniform random variables.

Convolution of two uniform random variables (S_{n} = X_{1} + X_{2} ) is a triangular function (piecewise linear).

Convolution of this triangular function with another uniform random variable (rectangular function) (S_{n} = S_{n-1} + X_{3} ) will now yield a quadratic function.

As the samples grow (n becomes large), these function multiplications yield a smooth center heavy and thin tailed bell function — the normal density.

Look at this animation. See how the uniform rectangular function X_{1} becomes a triangle (X_{1} + X_{2}) and quickly converges to a normal density for n = 5.

This one is for the sum of Poisson random variables.

Notice that even for n = 10, the distribution is not fully normal. It is not converging fast. And that is important to remember.

While the Central Limit Theorem is central to the probability theory, and it is a fundamental assumption for many concepts we will learn later, we should know that some distributions converge quickly, some do not.

We will learn about the normal distribution in detail in the next few lessons. As you prepare for the normal distribution, I will leave you with a comment posted last week about the normal distribution by a good friend who works in the insurance industry.

“As has been shown time and again, there is no such thing as a ‘normal’ distribution in the real world -;)”

Well, what can I say, he works on real work risk with real dollars at stake. Always take the word of a person who has skin in the game.

If you find this useful, please like, share and subscribe.
You can also follow me on Twitter @realDevineni for updates on new lessons.

Lesson 47 – Is it normal?

The wait time for the first/next arrival follows an Exponential distribution. The wait time for the ‘r’th arrival ( T_{r} = t_{1} + t_{2} + t_{3} + ... + t_{r} ) follows a Gamma distribution.

The probability density function of the Gamma distribution is derived using the convolution of individual random variables  t_{1}, t_{2}, ... t_{r} .

 f(t) = \frac{\lambda e^{-\lambda t}(\lambda t)^{r-1}}{(r-1)!}

For increasing values of r, the distribution is like this.

It tends to look like a bell. Is it normal?

Nah, it may be a Gamma thing. Let me add uniform distributions.

 f(x) = 1 \forall 0 < x < 1

For increasing values of n, the distribution of the sum of the uniform random variables is like this.

It tends to look like a bell. Is it normal?

Hmm. I think it is just a coincidence. I will check Poisson distribution for increasing values of \lambda. Afterall, it is a discrete distribution.

P(X=x) = \frac{e^{-\lambda t}(\lambda t)^{x}}{x!}; x = 0, 1, 2, ...

Tends to look like a bell. Is it normal?

Perhaps coincidence should concede to a consistent pattern. If this is a pattern, does it also show up in the Binomial distribution?

P(X=x) = {n \choose x}p^{x}(1-p)^{n-x}; x = 0, 1, 2, ... n

There it is again. It looks like a bell.

What is this? Is it normal?

The shape is limited to a bell. Is it normal?

It is the same for any variable. Is it normal?

Why is it normal?

What is the normal?

To be continued…

If you find this useful, please like, share and subscribe.
You can also follow me on Twitter @realDevineni for updates on new lessons.

Lesson 46 – How convoluted can it be?

After last week’s conversation with Devine about Gamma distribution, an inspired Joe wanted to derive the probability density function of the Gamma distribution from the exponential distribution using the idea of convolution.

But first, he has to understand convolution. So he called upon Devine for his usual dialog.

J: Hello D, I can wait no longer, nor can I move on to a different topic when this idea of convolution is not clear to me. I feel anxious to know at least the basics that relate to our lesson last week.

D: It is a good anxiety to have. Will keep you focused on the mission. Where do we start?

J: We are having a form of dialog since the time we met. Why don’t you provide the underlying reasoning, and I will knit the weave from there.

D: Sounds good to me. Let me start by reminding you of our conversation in Lesson 23 about probability distribution. You introduced me to the Chicago dice game where you throw a pair of dice to score the numbers 2 – 12 in the order of the rounds.

J: Yes, I remember.

D: Let’s assume that Z is that outcome which is the sum of the numbers on each dice, say X and Y.

 Z = X + Y

Create a table of these outcomes and what combinations can give you those outcomes.

J: We did this too during lesson 23. Here is the table.

D: Now, take any one outcome for Z, let’s say Z = 3, and find out the probability that the random variable Z takes a value of 3, i.e., how do you compute P(Z = 3)?

J: There are two ways of getting a number 3, when X = 1 and Y = 2, or when X = 2 and Y = 1. The total combinations are 36, so P(Z = 3) = 2/36.

D: Excellent. Now let me walk you through another way of thinking. You said the there are two ways of getting a number 3.

X = 1 and Y = 2
or
X = 2 and Y = 1

What is the probability of the first combination?

J: P(X = 1 and Y = 2) = P(X = 1).P(Y = 2) since X and Y are independent.

D: What is the probability of the second combination?

J: P(X = 2 and Y = 1) = P(X = 2).P(Y = 1), again since X and Y are independent.

D: What is the probability of Z = 3 based on these combinations?

J: Ah, I see. Since either of these combinations can occur to get an outcome 3, P(Z = 3) is the union of these combinations.

P(Z = 3) = P(X = 1).P(= 2) + P(X = 2).P(Y = 1) = 2/36

D: Yes. If you represent these as their probability mass functions, you get

 f(z) = \sum_{all-possible-combinations} f(x)f(y)

Let me generalize it to any function of X and Y so that it can help in your derivations later.

We are attempting to determine f(z), the distribution function of Z. P(Z = z). If X = x, then for the summation Z = X + Y to be true, Y = zx.

This corollary means we can find out f(z) over all possible values of x as,

 P(Z = z) = \sum_{-\infty}^{\infty} P(X = x)P(Y=z-x)

 f(z) = \sum_{-\infty}^{\infty} f_{X}(x)f_{Y}(z-x)

This property is called the convolution of  f_{X}(x) and  f_{Y}(y).

J: Then, I suppose for the continuous distribution case it will be analogous. The summation will become an integration.

D: Yes. If X and Y are two independent random variables with probability density functions  f_{X}(x) and  f_{Y}(y), their sum Z = X + Y is a random variable with a probability density function f_{Z}(z) that is the convoluton of  f_{X}(x) and  f_{Y}(y).

 f(z) = f_{X}*f_{Y}(z) = \int_{-\infty}^{\infty}f_{X}(x)f_{Y}(z-x)dx

The density of the sum of two independent random variables is the convolution of their densities.

The exact mathematical proof can also be derived, but maybe we leave that to a later conversation.

J: Understood. But like all basics, we saw this for two random variables. How then, can we extend this to the sum of n random variables. I am beginning to make connections to the Gamma distribution case that has the sum of n exponential random variables.

D: That is a good point. Now let’s suppose  S_{n} = X_{1} + X_{2} + ... + X_{n} is the sum of n independent random variables. We can always rewrite this as S_{n} = S_{n-1} + X_{n} and find the probabilty distribution function of S_{n} through induction.

J: Got it. It seems to follow the logic. Now, let me use this reasoning and walk through the derivation of the Gamma distribution.

D: Go for it. The floor is yours.

J: I will start with the two variable case. Our second meeting happened at lesson 9, and the time to the second arrival from the origin is  T_{2} = t_{1} + t_{2} = 9.

The random variable  T_{2} is the sum of two random variables  t_{1} and  t_{2} . I want to determine the probability density function of  T_{2} . I will apply the convolution theory. For consistency with today’s notations, let me take  T_{2} = Z ,  t_{1} = X , and  t_{2} = Y .

f_{Z}(z) = f_{X}*f_{Y}(z) = \int_{-\infty}^{\infty}f_{X}(x)f_{Y}(z-x)dx

f_{Z}(z) = f_{X}*f_{Y}(z) = \int_{0}^{z}\lambda e^{-\lambda x}\lambda e^{-\lambda (z-x)} dx

Both X and Y are bounded at 0, and if this is true,  y \ge 0 implies  x \le z, and  x \ge 0 implies  y \le z. Either way, the limits of the integral are from 0 to z.

f_{Z}(z) = f_{X}*f_{Y}(z) = \int_{0}^{z}\lambda^{2} e^{-\lambda x} \frac{e^{-\lambda z}}{e^{-\lambda x}} dx

f_{Z}(z) = f_{X}*f_{Y}(z) = \lambda^{2} e^{-\lambda z} \int_{0}^{z} dx

f_{Z}(z) = f_{X}*f_{Y}(z) = \lambda^{2} z e^{-\lambda z}

D: Excellent. Let me show how this function looks.

Do you see how the Gamma distribution is evolving out of exponential distribution?

J: Yes. Very clear.

D: Continue with your derivation.

J: For a three variable case, I will assume P = X + Y + S. I can also write this as P = Z + S analogous to  S_{n} = S_{n-1}+X_{n} .

Then I have the distribution function of P as

f_{P}(p) = f_{Z}*f_{S}(p) = \int_{0}^{p}\lambda^{2} z e^{-\lambda z} \lambda e^{-\lambda (p-z)} dz

f_{P}(p) = f_{Z}*f_{S}(p) = \lambda^{3} \int_{0}^{p}z e^{-\lambda z}\frac{e^{-\lambda p}}{e^{\lambda z}} dz

f_{P}(p) = f_{Z}*f_{S}(p) = \lambda^{3} e^{-\lambda p} \int_{0}^{p} z dz

f_{P}(p) = f_{Z}*f_{S}(p) = \lambda^{3} e^{-\lambda p} \frac{p^{2}}{2}

We can rewrite this as

f_{P}(p) = f_{Z}*f_{S}(p) = \frac{\lambda e^{-\lambda p} (\lambda p)^{(3-1)}}{(3-1)!}

so that the general Gamma distribution function for n variables becomes,

 f(t) = \frac{\lambda e^{-\lambda t}(\lambda t)^{r-1}}{(r-1)!}

D: Joe that is some well thought out derivation. You are really into this data analysis stuff now.

J: 😎 😎 Do we have anything else to cover today?

D: Using the same logic, can you derive the distribution for the sum of normals?

J: Normals? 😕 😕 😕


Oops, I think that is for the next week.
Don’t you have to get ready for the new year parties? It may be the coldest New Year’s eve on record. So you better bundle up!

Happy New Year.

If you find this useful, please like, share and subscribe.
You can also follow me on Twitter @realDevineni for updates on new lessons.

error

Enjoy this blog? Please spread the word :)