

Tom works in FedEx. He is responsible for weighing the parcels and estimating the cost of shipping. He verified the previous data on daily packages and found that the probability distribution resembled a normal distribution with a mean of 12 lbs and standard deviation of 3.5 lbs. There is an extra charge if the package weighs more than 20 lbs. Tom wants to know the probability that the parcels he weighs are within 20 lbs.


Perhaps you can help Tom. Did you solve the integral of the normal density function from last week?
Dick is excited to start his first job as a construction site engineer for H&H Constructions. He was told that the pH of the soil on this site follows a normal distribution with a mean pH of 6 and a standard deviation of 0.1. Yesterday he collected a soil sample with the following question in mind: “what is the probability that the pH of this soil sample is between 5.90 and 6.15?”


Can you answer Dick’s question? Did you solve the integral of the normal density function from last week?
Harry, a regular reader of our blog, is new at the Hamilton Grange. He has an idea to attract customers on Saturday. He suggested offering a free drink to anyone not seated within  minutes. Mr. Hamilton thought this was a cool idea and agreed to offer free drinks to 1% of the customers.
Can you work with Harry to compute x, the wait time, after which the customers get a free drink?
Before you help Tom, Dick, and Harry, what is your experience trying to solve the integral  ?
?
Could you not solve it?
Hmm, don’t feel bad. A closed form integral for this function is impossible.
How then can we compute these probabilities?
I am sure you are now thinking about some form of a numerical integration method for the definite integral. Maybe the trapezoidal method.
Maybe. That is the point. You can approximate the integral with reasonable accuracy.
But don’t you think it is a bit tedious to do this each time there is a normal distribution problem involved?
Enter Z, the Standard Normal Distribution
Let’s travel back to lesson 28 where we learned standardizing the data.
We can move the distribution from its original scale to a new scale, the Z-scale.
This process of standardization can be achieved by subtracting from the distribution, the mean of the data and dividing by the standard deviation. We have seen that when we subtract the mean and divide by the standard deviation, the expected value and the variance of the new standardized variable is 0 and 1.


Let’s find the expected value and the variance of this new random variable Z.
![E[Z] = E[\frac{X}{\sigma}] - E[\frac{\mu}{\sigma}]](https://i0.wp.com/www.dataanalysisclassroom.com/wp-content/ql-cache/quicklatex.com-3664dcc2c8dc733868274bb65ecb97ef_l3.png?resize=157%2C22&ssl=1 "Rendered by QuickLaTeX.com")
![E[Z] = \frac{1}{\sigma}E[X] - E[\frac{\mu}{\sigma}]](https://i0.wp.com/www.dataanalysisclassroom.com/wp-content/ql-cache/quicklatex.com-e061c179381ce78ffcb0c6df2c997664_l3.png?resize=169%2C22&ssl=1 "Rendered by QuickLaTeX.com")
![E[Z] = \frac{\mu}{\sigma} - \frac{\mu}{\sigma}](https://i0.wp.com/www.dataanalysisclassroom.com/wp-content/ql-cache/quicklatex.com-e4a30342682b7dbc21db72c090b16f8f_l3.png?resize=106%2C20&ssl=1 "Rendered by QuickLaTeX.com")
![E[Z] = 0](https://i0.wp.com/www.dataanalysisclassroom.com/wp-content/ql-cache/quicklatex.com-54d8cd66b39c08eaf948e18f078f2604_l3.png?resize=70%2C18&ssl=1 "Rendered by QuickLaTeX.com")
The expected value of the new standardized variable Z is 0. In other words, it is centered on 0.
Now, for the variance.
![V[Z] = V[\frac{X}{\sigma}] + V[\frac{\mu}{\sigma}]](https://i0.wp.com/www.dataanalysisclassroom.com/wp-content/ql-cache/quicklatex.com-fbc9568f8ab464fc118751b8b8bf53f6_l3.png?resize=158%2C22&ssl=1 "Rendered by QuickLaTeX.com")
![V[Z] = \frac{1}{\sigma^{2}}V[X] + 0](https://i0.wp.com/www.dataanalysisclassroom.com/wp-content/ql-cache/quicklatex.com-738f41cecafa4b8a2691976b1061630b_l3.png?resize=151%2C23&ssl=1 "Rendered by QuickLaTeX.com")
![V[Z] = \frac{1}{\sigma^{2}}\sigma^{2}](https://i0.wp.com/www.dataanalysisclassroom.com/wp-content/ql-cache/quicklatex.com-1f21dd56fe1779f3847d0a0c36d8a56e_l3.png?resize=98%2C23&ssl=1 "Rendered by QuickLaTeX.com")
![V[Z] = 1](https://i0.wp.com/www.dataanalysisclassroom.com/wp-content/ql-cache/quicklatex.com-eaf2a99a0ed57bbcb1a7197d4e37ad4e_l3.png?resize=69%2C18&ssl=1 "Rendered by QuickLaTeX.com")
The variance of the new standardized variable Z is 1. The standard deviation is 1.
The Standard Normal Z has a mean of 0 and a standard deviation of 1.
We just removed the influence of the location (center) and spread (standard deviation) from the original distribution. We are moving it from the original scale to the new Z-scale.
What are the units of Z?
Tom’s distribution can be moved like this.
![]()
Dick’s and Harry’s normal distribution will also look like this Z after transforming.
Subtracting the mean will give anomalies, i.e., differences from the mean centered on zero. Positive anomalies are the values greater than the mean, and negative anomalies are the values less than the mean.
Dividing by the standard deviation will provide a scaling factor; unit standard deviation for Z.
A weight of 15.5 lbs will have a Z-score of 1; 12 + 1*(3.5).
A package with a weight of 8.5 lbs will have a Z-score of -1; 12 – 1*(3.5).
Hence, the standardized scores (Z-scores) are the distance measures between the original data value and the mean, the units being the standard deviation. A package with a weight of 15 lbs is 0.857 standard deviations right of the mean 12 lbs.
Now, look at Tom’s question. What is the probability that the parcels he weighs are within 20 lbs?

Let’s subtract the mean and divide X by its standard deviation.


![]()
Dick’s question. What is the probability that the pH of this soil sample is between 5.90 and 6.15?


Harry’s problem. Compute x, the wait time, after which 1% of the customers get a free drink.


Harry knows that on Saturday night a customer’s wait time X for a table is normally distributed with a mean of 20 minutes and a standard deviation of 3.876 minutes.

For Tom and Dick, we are computing the probability. In the case of Harry, we are computing the value for x that will give a specific probability.
You must have observed that the common thread in all the cases is its transformation to the standard normal (Z).
In all the cases, it is sufficient to approximate the integral of Z numerically.

The standard normal tables you find in most appendices of statistics textbooks or online are the numerical integral approximations of the standard normal distribution Z. An example is shown here.

The first column z represents the standardized normal variable (z) and the columns after that represent the probability  . Notice that at z = 0,
  indicating that
  is 50%.
The probability ranges from 0 to 0.999 for z = -3.4 to z = 3.4 as we move from left of the scale to the right. The first column is the random variable z, and the subsequent columns are the probabilities or the areas corresponding the values of z. This animation will make it clear.

Look at this example on how to read the probability for a z-score of 2.28, Tom’s case.

 .
.
Dick’s question. What is the probability that the pH of this soil sample is between 5.90 and 6.15?
Answer: 0.7745. Did you check?
Harry has to equate
to the Z-score that gives a probability of 0.99.


 .
.
Read from the table. The probability for a Z-score of 2.33 is 0.9901.

You get a free drink if your seating wait time is greater than 29 minutes. 😉 Get the drink and continue to wait. It’s Saturday night on Amsterdam Avenue.
While you are waiting, think about the 68-95-99.7 rule of the normal distribution. Also, guess how many page views and users we have on our blog. We’ve traveled for close to a year now. Thank you so so much for this wonderful journey 🙂
If you find this useful, please like, share and subscribe.
You can also follow me on Twitter @realDevineni for updates on new lessons.


 , with some constants and parameters?
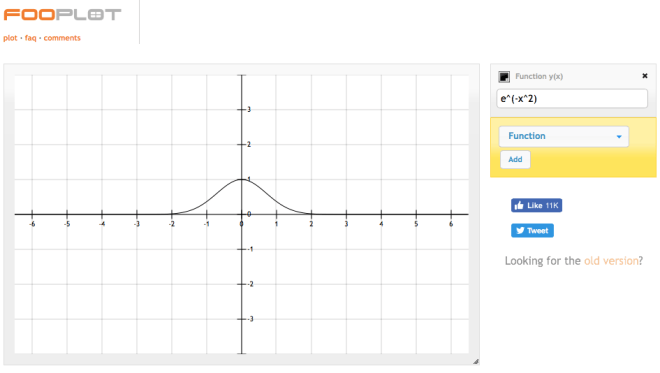
 can be positive or negative real numbers (continuous random variable)
  .
. and
and  are my control parameters.
 to say that I am a normal distribution with mean
  and standard deviation
  ), and the function is symmetric to its right and left.
  ).
).


 ?
? to
to 

 ?
?
 , where
 ) is the expected number of successes
  .
. exponential random variables.
 is the sum of
  independent random variables, then the distribution function of
  can be well-approximated by a continuous function knows as the normal density function given by
 and
and  are the expected value and variance of the original distribution.
 expanded into a Series, from whence are deduced some practical Rules to estimate the Degree of Assent which is to be given to Experiments.”

 , you will see how the normal distribution emerges as the limiting distribution.
 and
and  are two independent random variables with probability density functions
  and
and  , their sum
  is a random variable with a probability density function
  that is the convolution of
 ) is weighted using another function (for example,
  ) is a triangular function (piecewise linear).
 ) will now yield a quadratic function.
 becomes a triangle (
 ) and quickly converges to a normal density for n = 5.


 .
.


 . Afterall, it is a discrete distribution.

